
Weekly crypto price analysis for major tokens such as Bitcoin( BTC), Ethereum (ETH), Binance(BNB), Solana(SOL), XRP, Dogecoin(DOGE), and Cardano(ADA) has seen an impressive surge over the past month showing a promising outlook for the market. However, Most digital assets displayed a sideways trend in the past week, with bears and bullish struggling to gain momentum, indicating a potential consolidation phase.

Weekly chart: Coin360
Bitcoin (BTC) has broken below the $70,000 mark after a slight market correction. Over the past week, BTC has seen a slight bullish surge, with a +0.57 increase. BTC price is hovering around $69,800 level, eyeing more potential ahead.
This market movement underscores the volatile nature of cryptocurrencies and highlights how shifts in investor sentiment can lead to rapid price changes. However, there is still a bullish effect as long-term investors and analysts believe this correction may be a temporary setback in a larger upward trajectory.
The broader market has mirrored this positive trend, with significant buying interest observed across several key cryptocurrencies. Crypto exchanges are having a frenzy with cryptocurrency trading.
With the awaiting Bitcoin halving this month, most of the tokens might experience bullish trends. Historically, the halving event has been a catalyst for significant price movements in the cryptocurrency market.
Ethereum (ETH), holding the title of the second-largest digital currency by market cap, has experieced market volatility. The past week saw Ethereum breach the $3,500 barrier before retracing below it following the broad dip to touch a weekly low at $3,400. Similarly, Binance Coin (BNB) has shown remarkable stability, consistently trading below $600 and inching closer to overcoming the $580 support mark.
Solana (SOL), known for its efficiency and lower transaction costs, has emerged as one of the monthly standout performers, with its price soaring past $200, making it a new yearly high before a slight correction towards $170 levels, with a slight bearish trend.
XRP has seen a slight decrease over the past week, with a 4% decrease. Cardano (ADA) is not far behind, with ADA depreciating by more than 7% and stabilizing below $0.60. Dogecoin is still on the surge, with a 3% surge in the past 24-hours trading below $0.2, reflecting a slightly bearish trend in the meme coin sector over the past week.
Bitcoin(BTC)
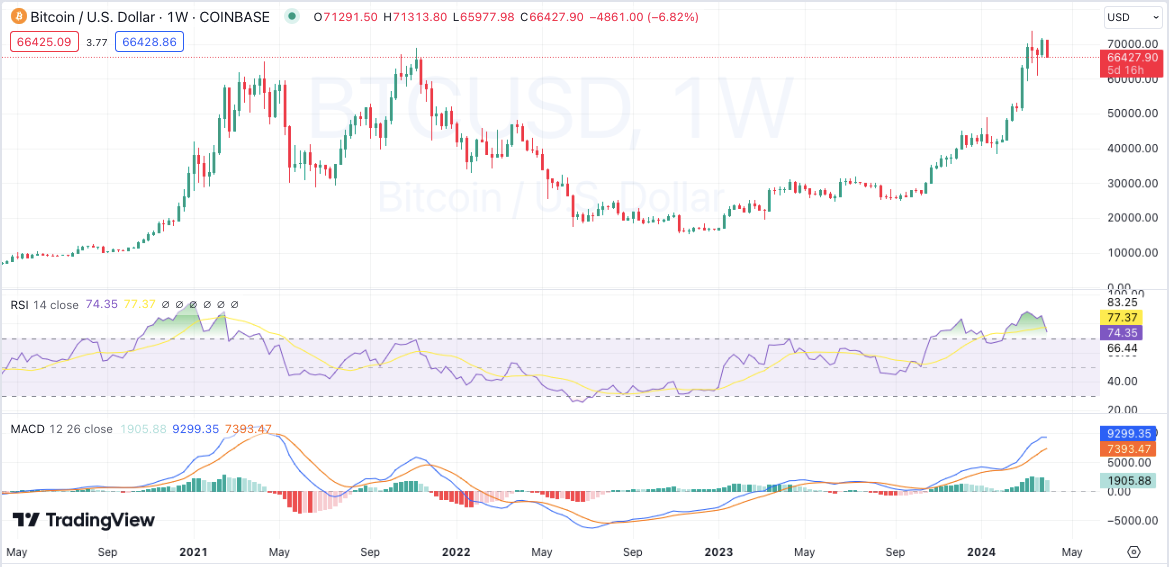
Bitcoin (BTC) has shown a slight volatility trend in the weekly chart, consistently finding strong support above the $69,000 mark. Currently, Bitcoin stands at $69,850, with an increase of 0.73% in the past 24-hours and a weekly slight surge of 0.57%. Bitcoin’s market capitalization crosses the $1.3 trillion threshold. However, Over the past month, Bitcoin has witnessed an increase of 4% in value, signaling a bullish momentum in the near term.
Bitcoin price chart: TradingView
However, the technical indicators still reinforce the optimistic outlook for the BTC/USD pair, with a minor signaling sell signal. The Relative Strength Index (RSI) demonstrates an overbought situation, reflecting a potent buying pressure within the market. Additionally, the Moving Averages Convergence Divergence (MACD) indicator still exhibits a bullish crossover, suggesting a potential bullish pressure. The 20-SMA and 50-SMA underscore this bullish trend, with the 20-SMA providing sturdy support for Bitcoin’s price.
Ethereum (ETH)
Ethereum (ETH), the market’s second behemoth, mirrors this bullish sentiment, having peaked at over $3,568 in the last week; however, over the past few days, it has seen a slight retracement in value, indicating a normal consolidation phase after its recent highs. Ethereum’s current trading price is $3,428, with an increase of 1.36%.

Ethereum price chart: TradingView
The technical landscape for ETH/USD is equally promising, with key indicators aligning on the bullish side of the spectrum. The RSI stands above the 60 mark, indicating vigorous market demand. The MACD’s bullish crossover points towards a continuing positive trend for Ethereum. Moreover, the 20-EMA and 50-EMA serve as significant support levels, bolstering Ethereum’s bullish posture in the market.
Binance Coin (BNB)
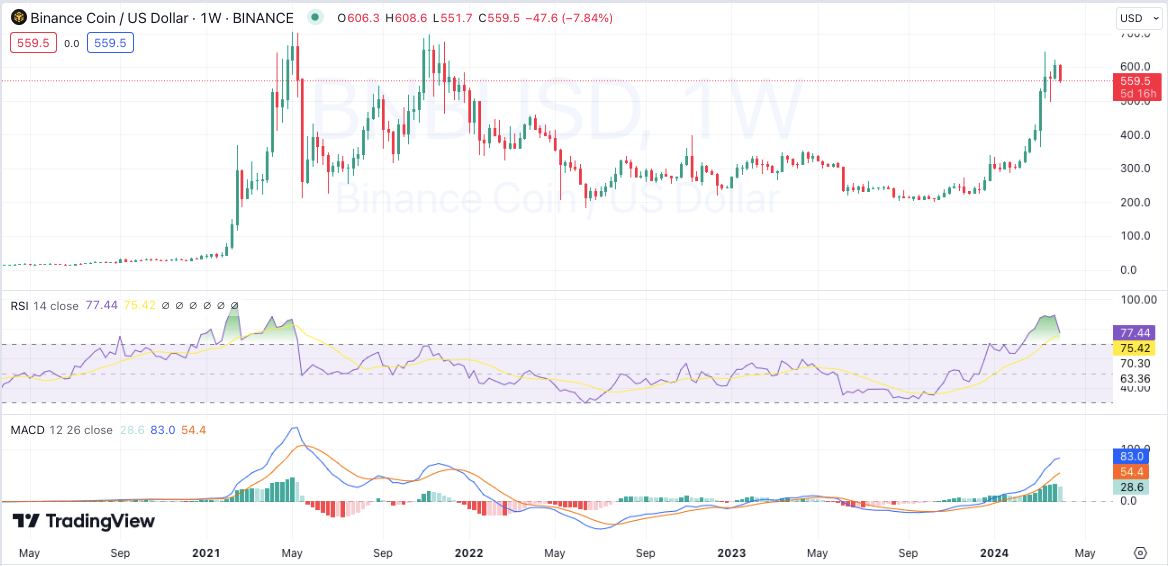
Binance Coin (BNB), the proprietary digital asset of the globally recognized Binance exchange, has showcased a slight bearish pattern over the recent week, breaking below $600. The market’s shift has seen a decrease of over 0.49% within the last seven days.
Presently, Binance Coin’s market capitalization stands impressively over $87.24 billion, positioning it as the fourth-largest cryptocurrency by market size. BNB’s trading price is $583, marking a 0.85% decrease in the past 24 hours.
Binance price chart: Tradingview
Technical indicators for the BNB/USD pairing suggest a trajectory for continued upward movement despite a slight pullback, with a consensus among indicators leaning towards a buy position. The Awesome Oscillator’s position above the zero line signals a continuing bullish momentum for Binance Coin.
Additionally, the 20-SMA and 50-SMA serve as pivotal support levels that may catalyze the asset toward encountering new resistance thresholds. Both the RSI and MACD indicators align with a bullish future for BNB.
Solana (SOL)
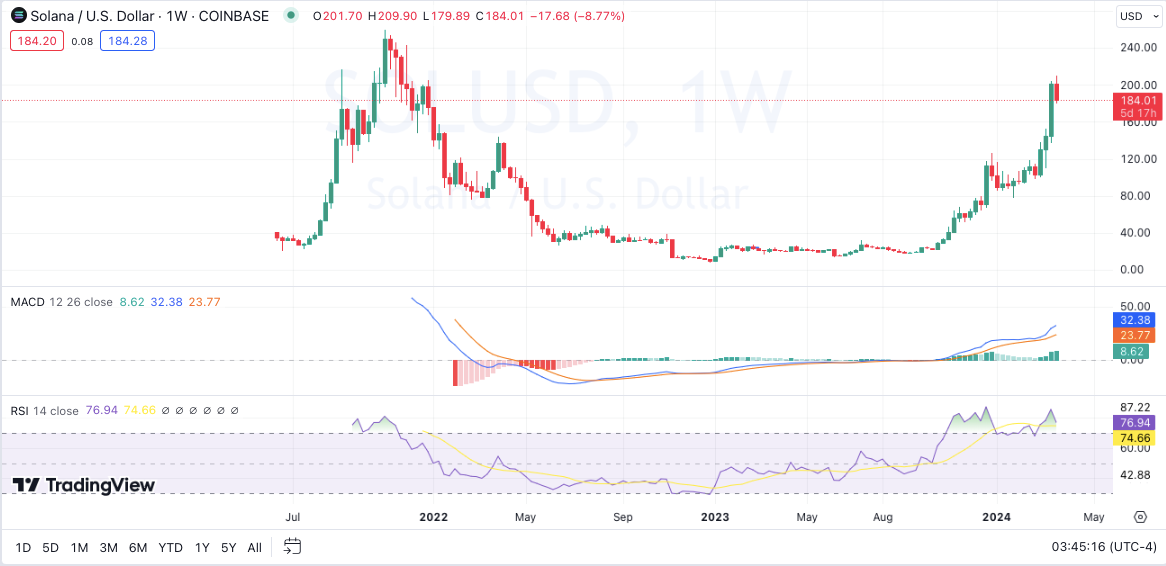
Solana (SOL), marking its presence as one of the standout performers over the past month, has witnessed its price surge beyond $200, making it the top gainer in the past month. This altcoin has been on a bullish ascent, bolstered by increasing purchasing pressure and setting new yearly highs.
However, over the past week, SOL has seen a slight pullback of more than 10%, indicating a bearish trend. Currently, Solana is priced at $176, with a notable 2.02% decrease over the last 24 hours.
Solana price chart: Tradingview
Continued bullish momentum could see SOL challenging the $200 resistance level. Conversely, if the bears stage a comeback, Solana will find substantial support at the $150 threshold. The technical outlook for SOL/USD hints at a promising uptrend, with most indicators advocating a buy. Venturing into the overbought territory, the RSI signifies intense market interest in Solana. The MACD echoes this bullish sentiment, while the 20-MA supports SOL’s current market position.
XRP
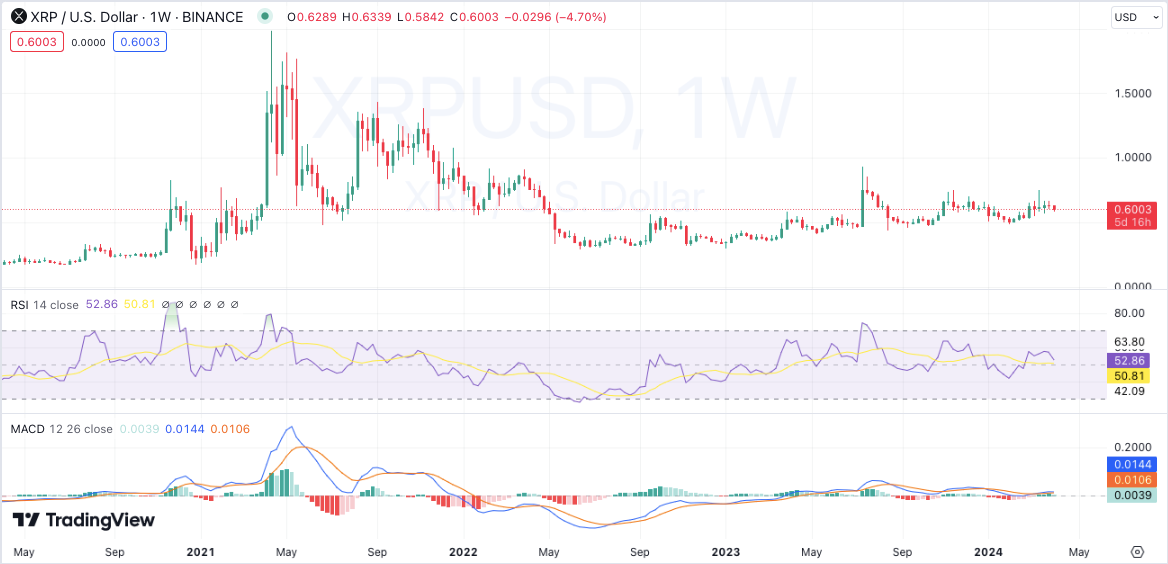
XRP has seen a slight decrease in price over the past week after a slight correction in the market. The XRP/USD pair broke past this level, oscillating around the $0.60 resistance point. The past 24-hours saw an XRP decrease of approximately 0.03%, with its current trading value at $0.5956.
XRP price chart: Tradingview
If XRP’s momentum is sustained, breaking through the $0.65 barrier might set its sights on reaching $0.90, though this level presents a formidable challenge. However, if bears countinue mounting more pressure, XRP will hit the $0.45 level soon.
The Relative Strength Index, below 60, indicates that the market is neutral. The MACD indicator’s bullish crossover hints at the potential for further price ascension, with the 20-day EMA and 50-day SMA reinforcing XRP’s support base.
Cardano(ADA)
Weekly crypto market analysis shows that ADA/USD has been trading in a sideways trend, with bulls and bears struggling to gain momentum. Over the past week, Cardano’s price has seen a decrease of 7%, currently trading at $0.5843.

Cardano price chart: Tradingview
However, the technical indicators for ADA/USD also support a bullish outlook, with most indicators showing a buy signal. The RSI is hovering at 50, indicating buying pressure in the market. The MACD indicator has also formed a bullish crossover, showing potential for further upside in price. The 20-MA and 50-MA are acting as strong support levels for ADA.
Dogecoin (DOGE)
Dogecoin (DOGE), the meme-based cryptocurrency, has seen a decrease in price over the past week. Dogecoin has been trading below $0.2 for the past few weeks, with a surge of more than 4.31%, in the past days. Currently, the Dogecoin is at $0.2021 with a weekly surge of 3 percent.

Dogecoin price chart: Tradingview
The technical indicators for DOGE support a neutral sentiment. The MACD indicator has shown a bullish crossover, indicating strong buying pressure in the market. The RSI is hovering below 70 levels, indicating a neutral market trend. The 20-day EMA is above the 50-day SMA, supporting a bullish trend.
Weekly crypto price analysis conclusion
Weekly crypto price analysis of popular digital assets shows that most are showing sideways signs, with some experiencing slight upticks and others experiencing slight downticks, reflecting a period of consolidation in the market. The technical indicators seem to support a bullish outlook, with buying pressure expected to continue in the coming weeks.
