
Ripple’s price has been consolidating over the last few weeks, failing to continue its recovery. Yet, there is still the probability for the market to rise higher.
Technical Analysis
By TradingRage
The USDT Paired Chart
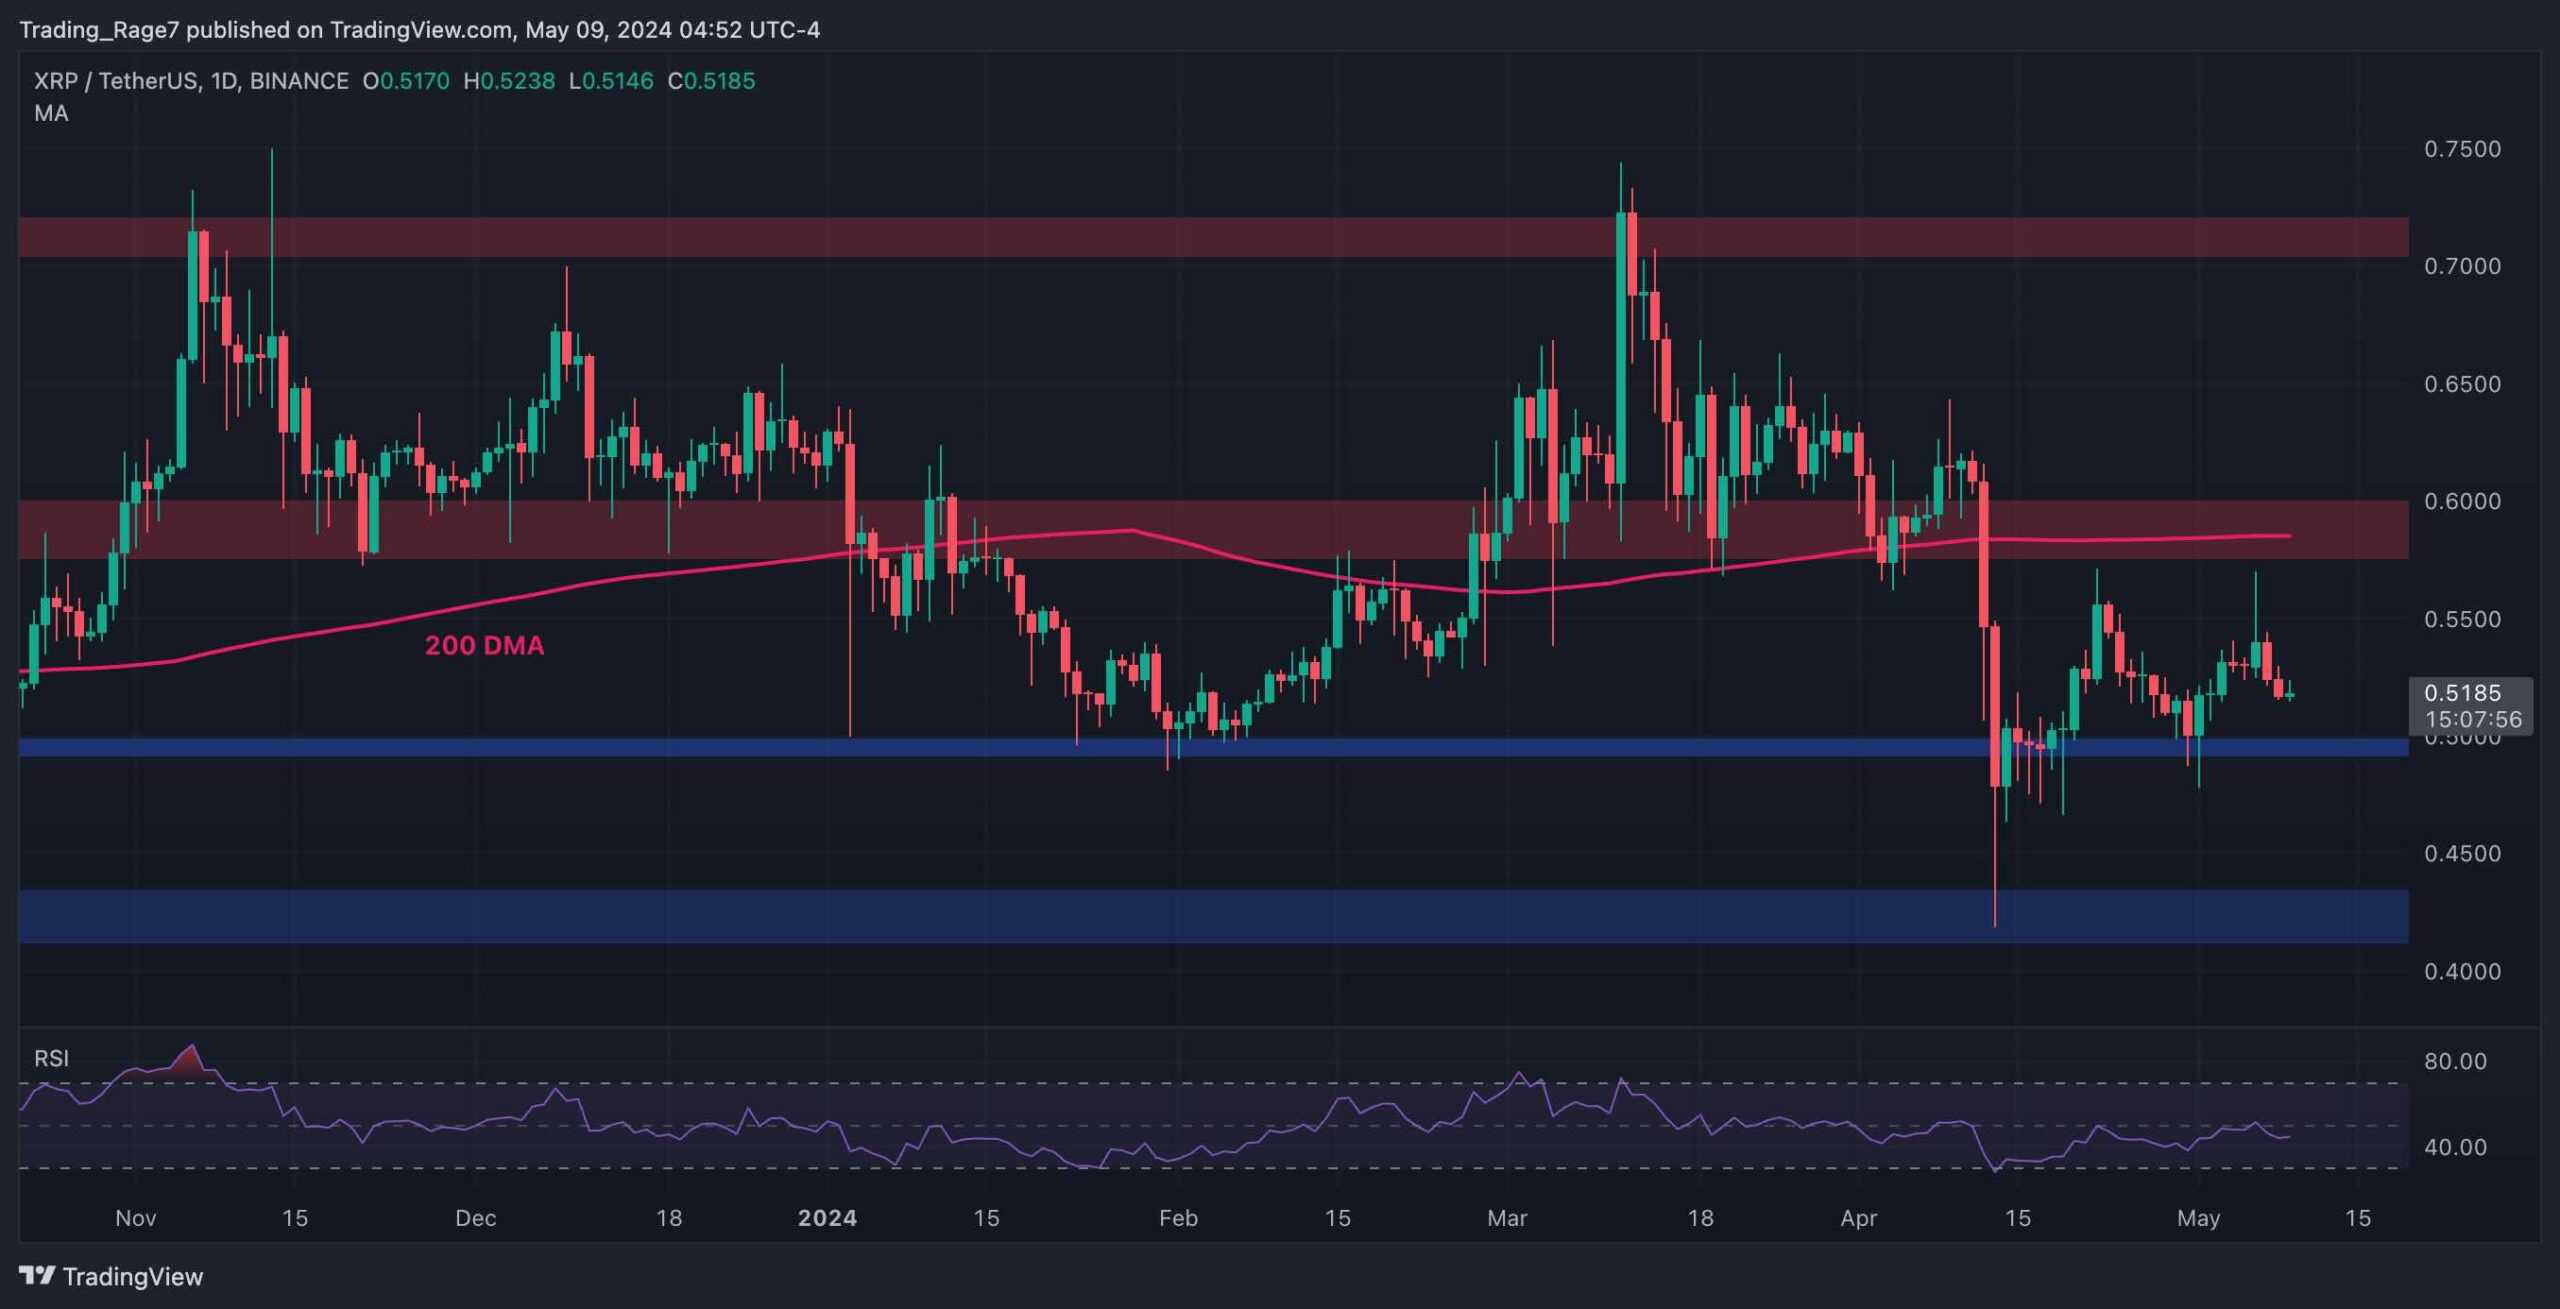
On the USDT paired chart, the price has recently rebounded from the $0.4 support zone and climbed above the $0.5 level. Yet, the 200-day moving average, located around the $0.6 mark, is still intact.
The price is currently dropping toward the $0.5 level once more. If the level holds, XRP might rally toward the 200-day moving average. However, with the RSI showing values below 50%, market momentum is still in favor of a bearish move.
The BTC Paired Chart
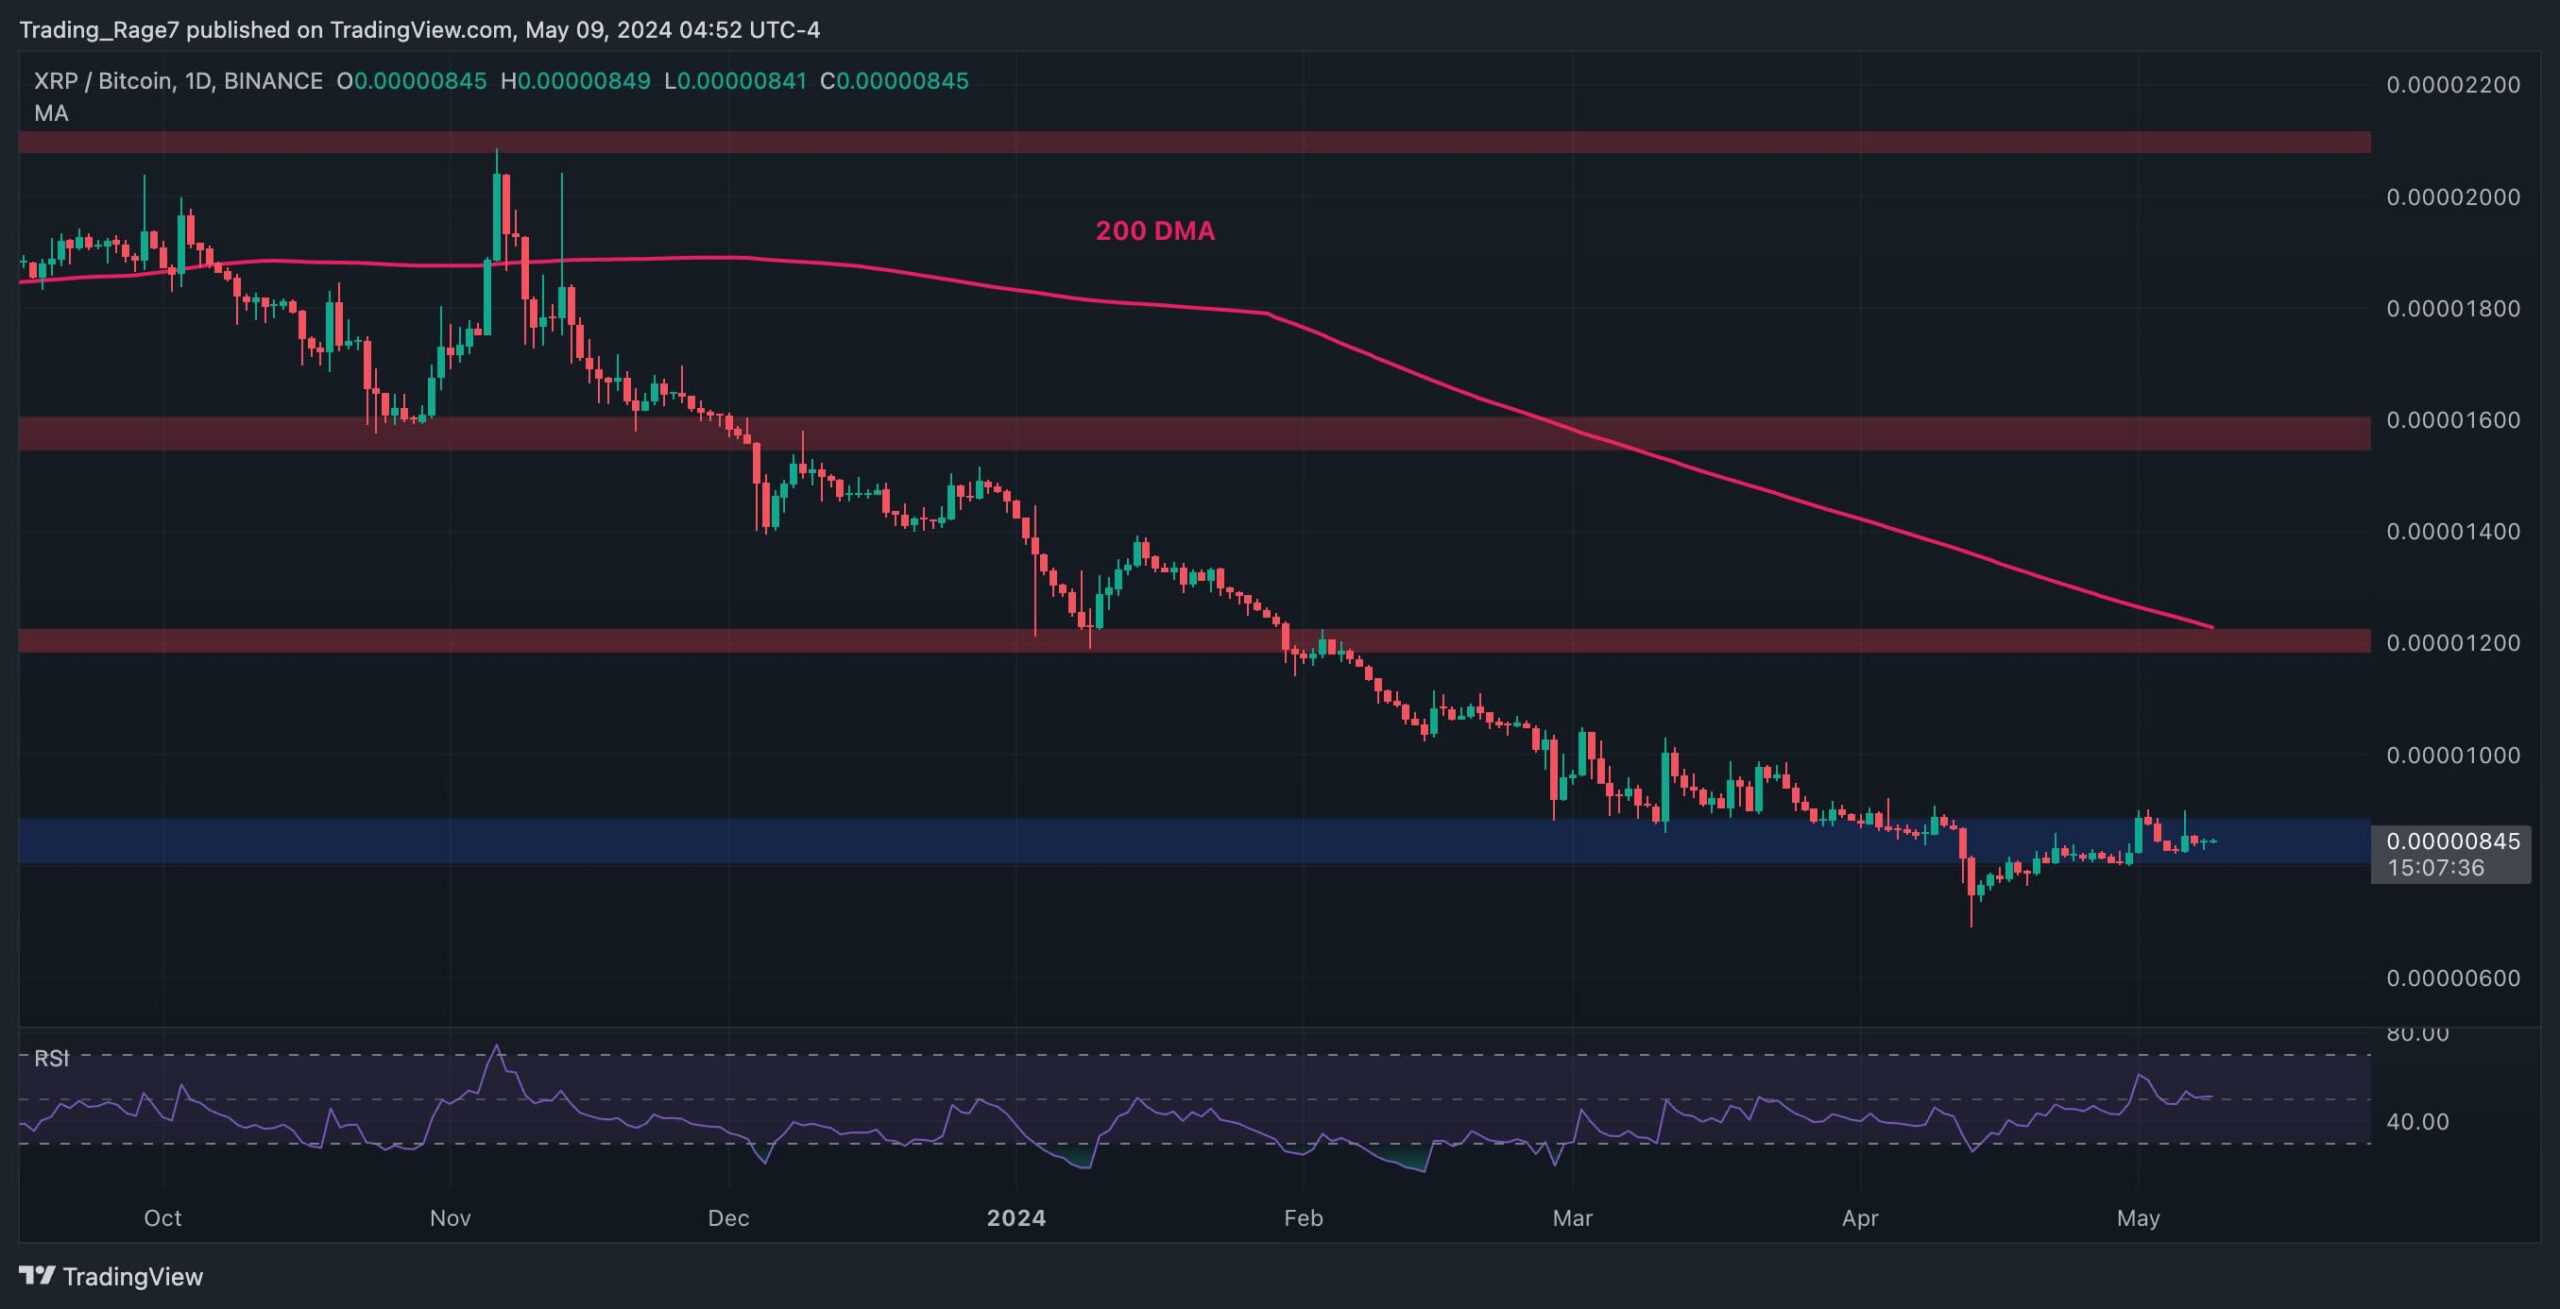
Looking at the chart against Bitcoin, it is evident that the market’s downtrend has finally come to a halt, with the 800 SAT level preventing the price from dropping lower. Meanwhile, the Relative Strength Index has been oscillating around the 50% level, indicating that the market is in equilibrium.
If the 800 SAT area holds, investors can be optimistic that the XRP price can climb toward the 1200 SAT resistance level and the 200-day moving average located around the same mark. Yet, while the cryptocurrency remains below the 200-day moving average, the market’s trend cannot be considered bullish.
The post Calm Before the Storm: XRP Primed for Massive Volatility if $0.5 Holds (Ripple Price Analysis) appeared first on CryptoPotato.

